Setup Prometheus, Node Exporter, Cadvisor and Grafana in Docker
When running a headless home server, you may want to set up a monitoring solution to keep track of your server's performance. Node Exporter will expose your server's metrics, cAdvisor will expose metrics for Docker containers, and Prometheus will scrape and collect those metrics, which is then used as a data source for Grafana dashboards. Here's how to get it all set up in Docker.
Table of Contents
Prepping the Compose file and Prometheus config files
First things first, if you haven’t yet, you can install Docker and all dependencies quickly with the following command:
curl -fsSL https://get.docker.com | sh
First let’s create the compose.yml file. Note, I like to put all my Docker container volumes under one place in my home directory, but change the paths to match your own. Also, note I’ll be using some different port mappings in the below examples, but you should use the default or any other ports of your choosing.
version: "3"
services:
  prometheus:
    image: prom/prometheus:latest
    container_name: prometheus
    volumes:
      - /home/ariel/docker/prometheus/prometheus.yml:/etc/prometheus/prometheus.yml
      - /home/ariel/docker/prometheus/data:/prometheus
    command:
      - "--config.file=/etc/prometheus/prometheus.yml"
      - "--storage.tsdb.path=/prometheus"
      - "--web.console.libraries=/etc/prometheus/console_libraries"
      - "--web.console.templates=/etc/prometheus/consoles"
      - "--storage.tsdb.retention.time=200h"
      - "--web.enable-lifecycle"
    restart: unless-stopped
    ports:
      - 9999:9090

  nodeexporter:
    image: prom/node-exporter:latest
    container_name: nodeexporter
    volumes:
      - /proc:/host/proc:ro
      - /sys:/host/sys:ro
      - /:/rootfs:ro
    command:
      - "--path.procfs=/host/proc"
      - "--path.rootfs=/rootfs"
      - "--path.sysfs=/host/sys"
      - "--collector.filesystem.mount-points-exclude=^/(sys|proc|dev|host|etc)($$|/)"
    restart: unless-stopped
    ports:
      - 9100:9100

  cadvisor:
    image: gcr.io/cadvisor/cadvisor:latest
    container_name: cadvisor
    privileged: true
    devices:
      - /dev/kmsg:/dev/kmsg
    volumes:
      - /:/rootfs:ro
      - /var/run:/var/run:ro
      - /sys:/sys:ro
      - /var/lib/docker:/var/lib/docker:ro
      - /cgroup:/cgroup:ro
    restart: unless-stopped
    ports:
      - 8888:8080

  grafana:
    image: grafana/grafana:latest
    container_name: grafana
    volumes:
      - /home/ariel/docker/grafana/data:/var/lib/grafana
      - /home/ariel/docker/grafana/provisioning/dashboards:/etc/grafana/provisioning/dashboards
      - /home/ariel/docker/grafana/provisioning/datasources:/etc/grafana/provisioning/datasources
    environment:
      - GF_SECURITY_ADMIN_USER=${ADMIN_USER:-admin}
      - GF_SECURITY_ADMIN_PASSWORD=${ADMIN_PASSWORD:-password}
      - GF_USERS_ALLOW_SIGN_UP=false
    restart: unless-stopped
    ports:
      - 3000:3000
Make sure to change the ADMIN_USER and ADMIN_PASSWORD above to whatever you want to use as a login for Grafana. Now before starting the containers, we need to create a directory for prometheus and within it create a file prometheus.yml with the following contents (using your own IP address and port mappings):
global:
  scrape_interval: 5s
  scrape_timeout: 10s
  evaluation_interval: 15s

scrape_configs:
  - job_name: "nodeexporter"
    scrape_interval: 5s
    static_configs:
      - targets:
          - 192.168.0.100:9100

  - job_name: "cadvisor"
    scrape_interval: 5s
    static_configs:
      - targets:
          - 192.168.0.100:8080

  - job_name: "prometheus"
    scrape_interval: 10s
    static_configs:
      - targets:
          - 192.168.0.100:9999
You’ll need to set the correct permissions for everything to work properly. Use your own directory’s path, but make sure to set owner and group exactly as shown below:
sudo chown -R 65534 /home/ariel/docker/prometheus
sudo chgrp -R 65534 /home/ariel/docker/prometheus
sudo chmod -R 777 /home/ariel/docker/prometheus
Start up the containers and confirm they are working
Now it’s time to create the stack and get our containers up and running by using the following command:
docker compose up -d
It’ll take a few minutes to download and star the containers. To confirm everything is up and running, first go to the Prometheus web UI at http://192.168.0.100:9090.

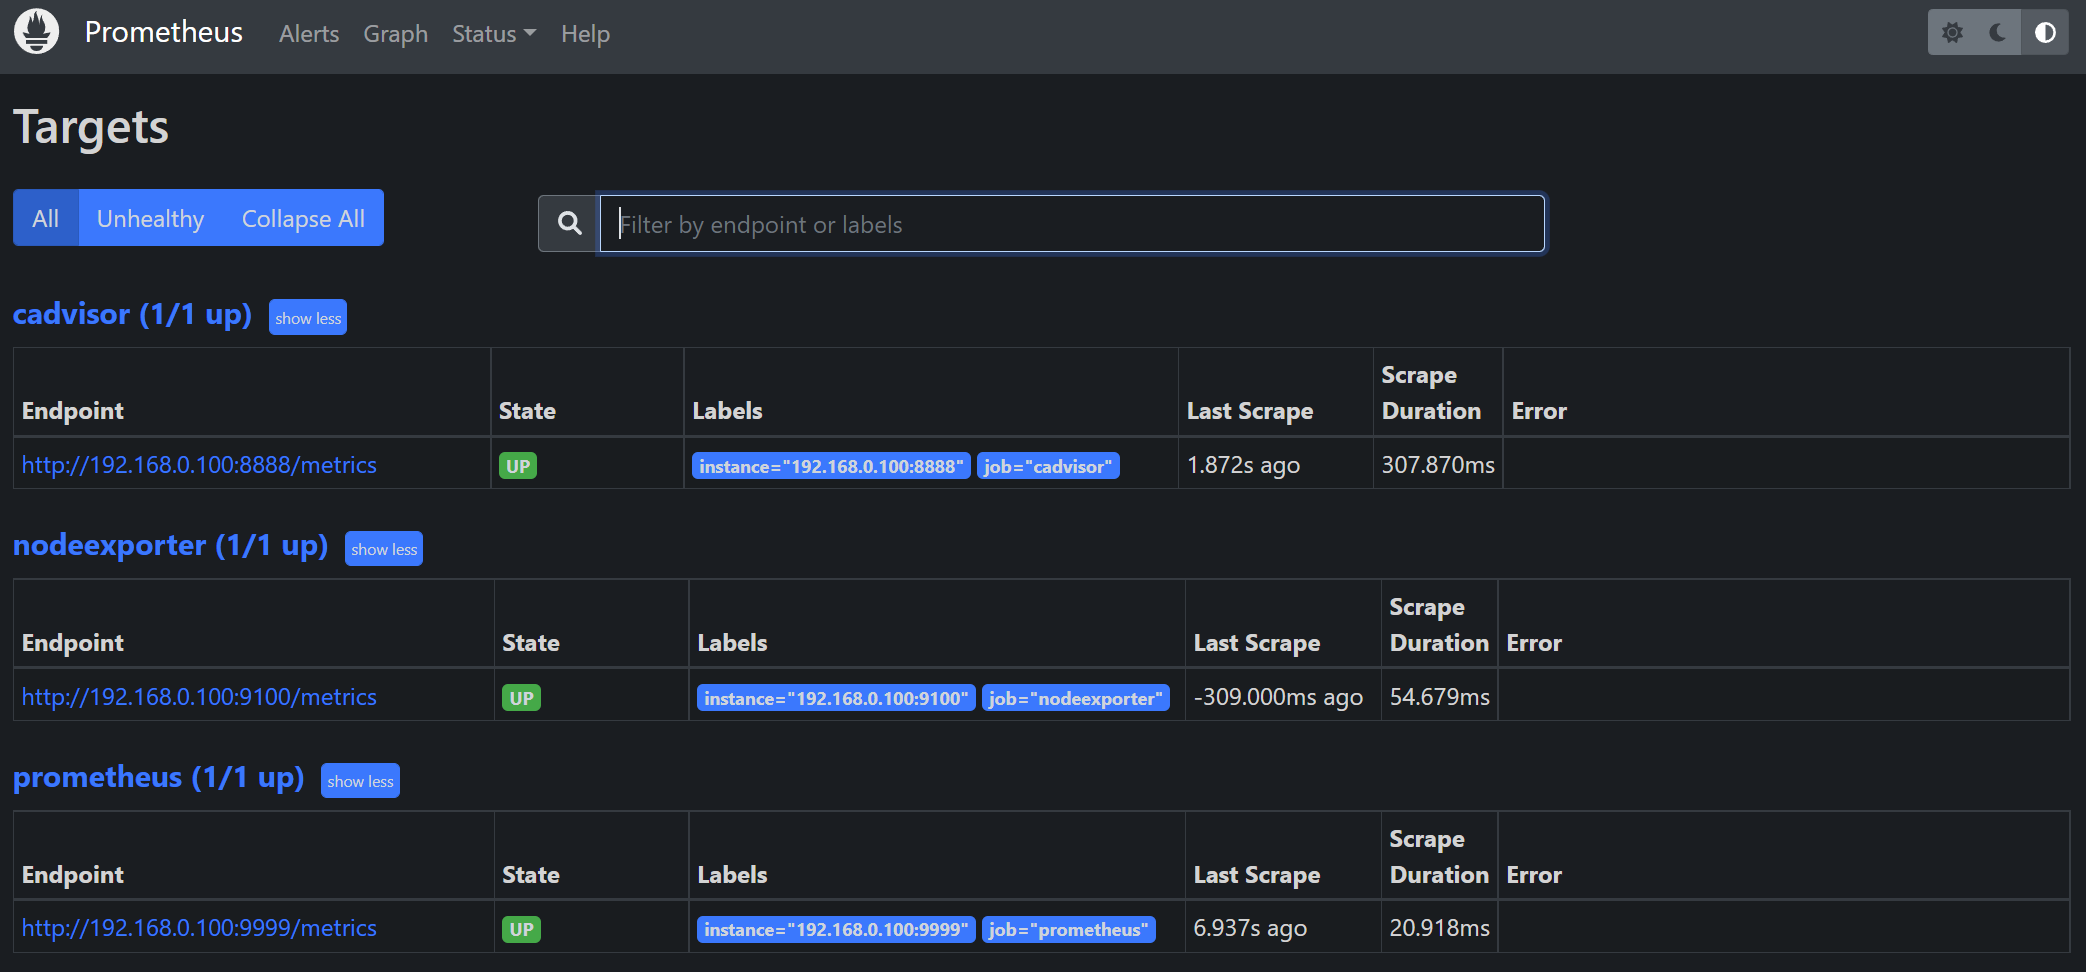
On the navigation bar at the top, click on Status then select Targets from the dropdown. If all the other containers are up and running as intended, and your prometheus.yml is filled out correctly, it should look like this:

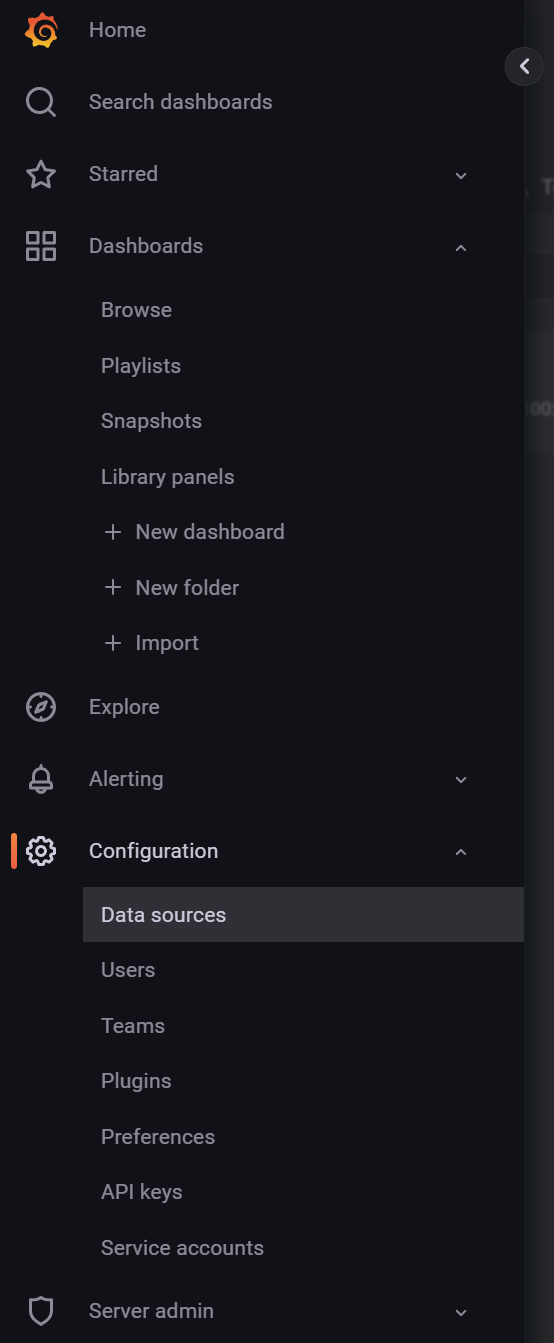
Good to go! Now go to the Grafana web UI at http://192.168.0.100:3000, click the Arrow button on the left bar to expand the navigation menu, then click on Configuration and select Data Sources from the drop-down.

You should see Prometheus with it’s endpoint already set as a default Data Source.

Now you’re ready to create your dream Grafana dashboard! Creating the actual dashboard is beyond the scope of this article, but I may write about it in the future. For now, you might want to use dashboards created by others to start visualizing some metrics and learning the ropes.